 Special thanks to my co-worker Tom Souverain for the illustration \o/
This blog post was initially posted on our company blog, I replicated it here solely for archiving purposes.
Algolia’s architecture is heavily redundant, hosting every application on at least three different servers (called clusters). We do this to ensure the greatest possible reliability. This underpins our SLA, ensuring a 99.99(9)% uptime, allowing you to reliably ship enterprise-grade search without having to worry about the underlying infrastructure.
Redundancy is, however, only one part of a high-availability system; there is still a large unknown between our users and our infrastructure–the network. All search queries rely on network availability and are subject to its underlying latency. To manage network fallibility, Algolia’s API Clients implement a “retry strategy”, where a server is determined to be “unavailable” based on a set of simple heuristics which, when triggered, cause the API Client to retry the same query by bypassing the main application DNS record and targeting one of the server nodes directly.
This retry logic switches the targeted server whenever it detects that one of them is down or unreachable. Therefore, a given request will not fail unless all servers are down or unreachable at the same time. Which is unlikely – especially given that a cluster’s servers are in different data centers which are separated geographically.
For this purpose, we need to decide what “unavailable” means (a topic that could probably deserve its own blog post). For simplicity’s sake, a server node is deemed unavailable if the request to retrieve results takes more than X amount of time. For each time a request would take more than X amount of time, we would increment Y and start a new request, this time targeting a specific server node. We defined X to be a starting value of 1000ms multiplied by Y, where Y was the number of times a request has timed out in the current session. This gave us a basic retry strategy that worked but was not adjusted for different network conditions.
Adjusting for a variable network environment
There is sadly no such thing as a perfect nor reliable network and no two networks or providers are the same. Enter an old concrete building or an event where the local network is overloaded by peers and you will quickly understand how unreliable Wi-Fi or 4G can get. As a SaaS business, we cannot guarantee the connection of our users, but we do however want to provide a good search experience for all of them, irrespective of what their network capabilities are.
This is where our retry strategy definition overlaps with our business goals and poses a potential risk. Because we use a default static number (1000ms) for our timeout logic, we are not catering to the real network conditions that our customers are subjected to. Users on slow connections will trigger our retry strategy when they do their first query to algolia servers because our client timeout defaults are too low; this, in turn, causes their original search requests to be canceled and another request to be sent to Algolia–doubling the time they need to receive the request.
If we could know the network capabilities of these users, we could set our timeouts high enough to prevent false positives while still preserving the retry logic for when a server request might fail.
Motivations for improvements
Delivering fast(er) queries
If you are an e-commerce, media, or any other kind of online business, customer retention and satisfaction are key. In a world where nobody likes waiting, the last thing you want is to have your users stare at a blank screen waiting for the results of a search query. Amazon found that a 100ms delay causes about a 1% drop in revenue and that loading 30 results instead of 10 delayed the page rendering by .5 seconds and caused a 20% drop in traffic.
Capitalizing on a fast search experience could be one of the key differentiators between you and your competitors and it just might be the reason why users end up using your website rather than a competitor’s one.
Shifting the blame
Slow server response time, however, is not necessarily an engineering fault. As software engineers, we can do a lot to improve how our content is delivered, but because we don’t entirely control the network stack, our users are still left with a best-effort service, which often suffers from the last mile problem.
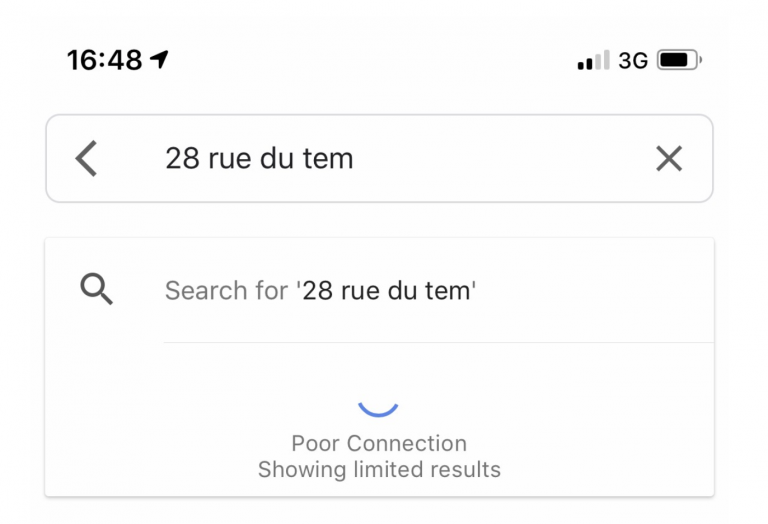
Take, for example, a user who is trying to access your website from a poor network. If you tell this user “Your results are loading”, they might be frustrated by your service and leave your site–even though it is their network and not your service which is the cause of the slowdown.
Enhancing the experience by saying “You are on a poor network, the results might take a while” shifts the blame to their provider, making them more likely to wait for the actual results to arrive, knowing that your website is not to be blamed. (Facebook study about the psychological effects of loaders.)
Using NetInfo API
The Network Information API is currently a living draft document under WICG. It holds important information about the network capabilities of the client such as its effective connection type, downlink, and round-trip time information. If we were blindly initializing the timeout times to an arbitrary number before, we can now make better-educated adjustments and initialize the client with a better timeout configuration.
Network Information API also ships with a very useful onchange callback that is invoked when the connection of our user changes. This means we can now cater for users that start using our page on a good connection but later experience a slow connection due to external conditions (such as the concrete building example above). Or vice versa.
By leveraging the NetInfo API, we can start adjusting for some use cases that we could not handle before. Let’s look at some examples below:
Search query under perfect network conditions (4G, Wi-Fi):

Query was sent under good network conditions, no timeout was triggered, and it took a total of 600ms for the request to travel over the network. This includes resolving DNS, negotiating TLS, and establishing a TCP connection.
Search query under slow network conditions (3G):

Query was sent under degraded network conditions, which in turn exceeded the static timeouts we initially set (1000ms) and a query was retried. We can quickly see how not knowing the network that the client is subject to has cost us an extra request which increased the total time needed to retrieve a response (in this case 1000ms + 1500ms instead of only 1500ms).
Search query under under terrible network conditions (slow 2G):
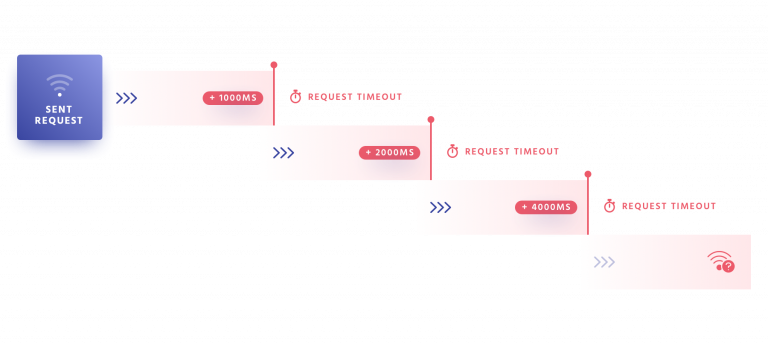
Search query is sent under terrible network conditions, each request is retried with an exponentially increasing timeout, ultimately retrieving a response.
Search query under changing network conditions:
Search query is sent under good network conditions, which might change during the session.
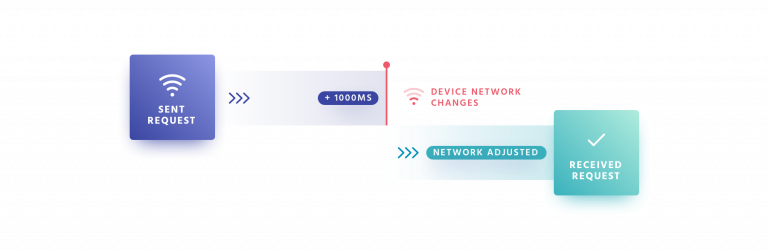
Network-adjusted search query:

By leveraging the NetInfo API, we can adjust the timeout settings of the client and appropriately set timeouts based on actual network conditions that our user is experiencing, thus reducing the number of retried requests and decreasing the total time it takes for our search engine to respond with results.
Implementing our solution
Knowing the use cases, API’s, and our desired outcome, we can now leverage the NetInfo API to adjust the timeout strategy of our clients based on real network conditions.
Because Network Information is an experimental API, we need to check for feature support. Once we assert the availability of the API, we can then initialize the timeouts of our JavaScript client from the network RTT times and register the onchange handler.
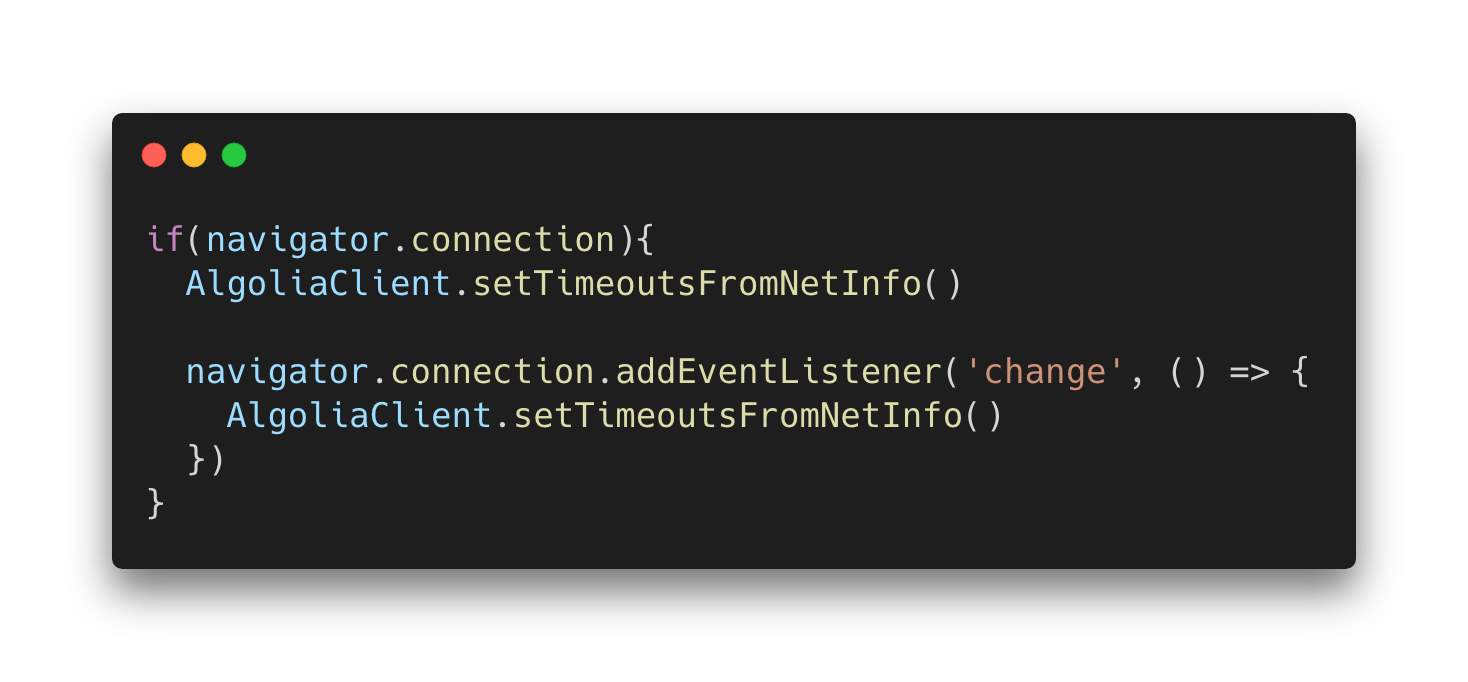
(Important: You should also check for connection.rtt being a number, because of partial support in some cases. Note that pseudo-code above is not meant to be copy-pasted.)
If NetInfo API is not available, we can use the Resource Timing API. As pointed out by Ilya on twitter, it contains enough information for us to build a better-informed retry strategy without having the NetInfo API available.
Using the two API’s we are now closer to having a dynamic retry strategy based on real-world network conditions. See below example of how hn.algolia.com has been updated to resemble real network conditions.
We are now able to set better timeout defaults and avoid the retry strategy from being triggered due to bad defaults; original requests are no longer cancelled and retried when users are subject to bad network conditions. This, in turn reduces the amount of time it takes for those users to get their search results, saves device bandwidth, and saves CPU on our search server (because only a single request is sent, the engine doesn’t have to do the work twice).
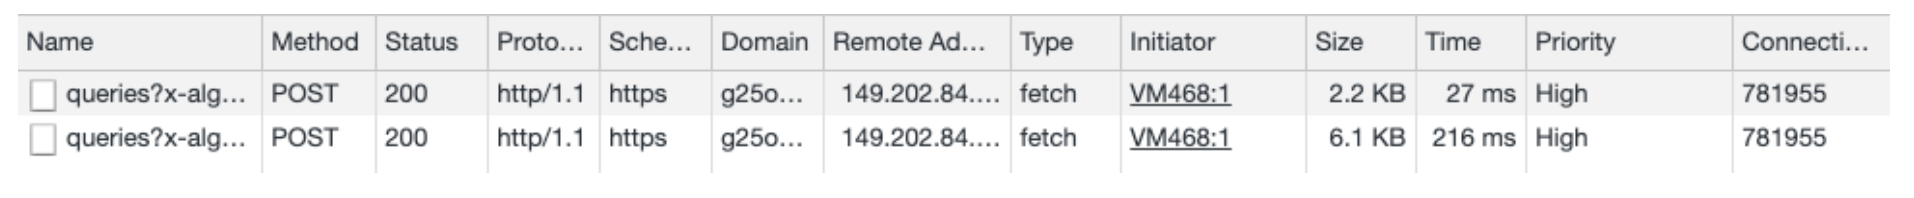
Here is a side-by-side rendering performance comparison of our old (left) vs our new retry strategy (right) under throttled 3G network conditions.
If you look at the Chrome developer tools on the left, you can see that the original request times out and is retried by our client whereas, on the right, the timeout is set depending on actual network conditions. With this modification, we managed to save about ~800ms under current simulation.
Making sure we have data
Before doing all these changes, we setup a monitoring API so that we could measure our changes. This API reported each timeout occurrence as well as client and network information. We have added “slow-connection” events to GoogleAnalytics for every time a user would see the “You are on a slow connection” loader. This allows segmentation of user sessions into slow and fast connections.
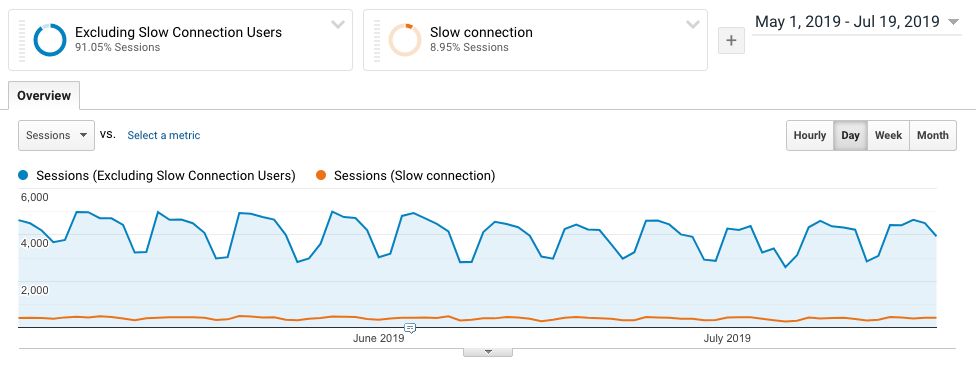
Though Algolia provides one of the fastest search engines, thanks in part to its distributed search network, which places the data closer to your users, we can still observe that about ~9% of this application’s users are experiencing slow times from querying to rendering results due to a slow network.
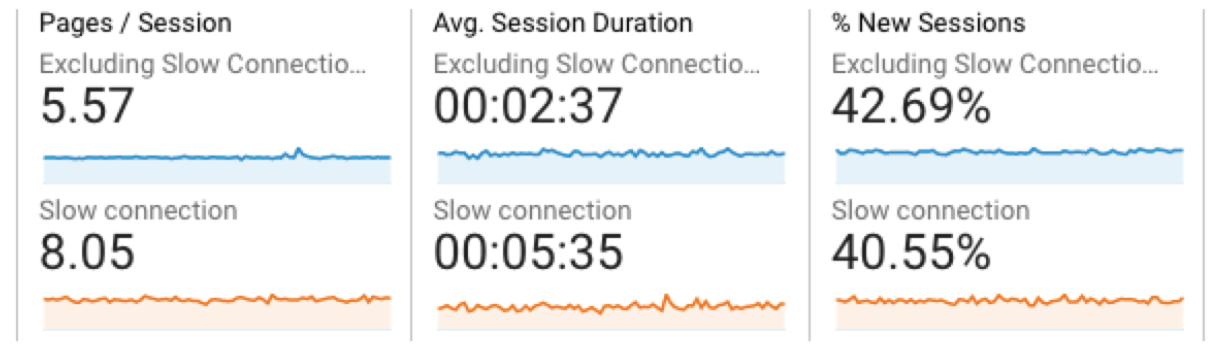
Using Google Analytics, we can now compare users on slow connections and see that they are spending almost double the time on the page. Because search is a primary function of hn.algolia.com, we can imagine that users spend most of their time waiting for results.
Improving the developer and user experience
Knowing a response will be slow, we can start by enhancing the user experience by showing a loader and explaining where the delay is coming from. This allows us to better manage user expectations as well as explain why a certain action is delaying the experience, avoiding frustration, and hopefully resulting in increased time that our users are willing to spend waiting.
Let’s look at the following example:
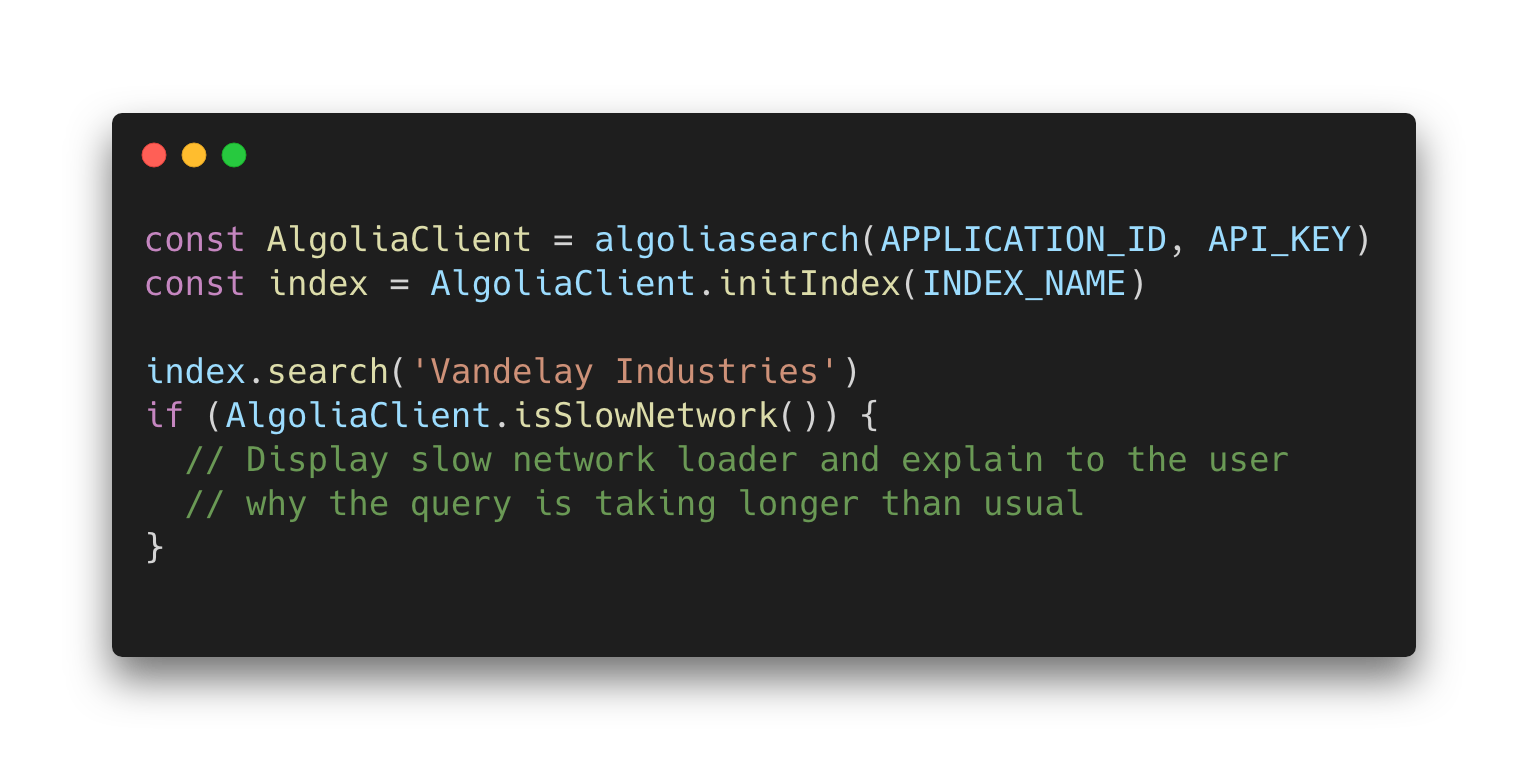
By adding a built-in method, we would give developers a quick way to decide how to handle these cases, helping them focus on the actual implementation of their search UI and keeping their users happier even under degraded network conditions. This puts us one step closer towards helping you build the best search experience for your users.
Going beyond the slow network loader
Having a slow network indicator is a good first step, but we can now go beyond explaining the situation to actually speeding up the queries for these users. One of the options that we can now consider is to reduce the number of search results that we are requesting, decreasing the total response size and getting those results on the screen faster for our users. Depending on the transfer size of your search results, this can have a significant impact on how fast your search results are displayed.
Another option that we can now consider is debouncing queries for users on slow connections. If we know the requests are going to be slow, we can save bandwidth and not send queries at every keystroke, thus saving device bandwidth for other critical operations that it might need it for. We can also do this if the navigator.connection.saveData is true, an attribute which indicates if the user has requested a reduced data usage mode.
What this means for us at Algolia and our users
Adjusting for these situations provides a better search experience for all of our users, irrespective of their location, network, or device capabilities, and brings us a step closer to providing a better search experience for everyone. NetInfo API also opens up opportunities for developers to test and decide on how to best handle these use cases. As we continue to work on improving search for both you and your users, we are looking for feedback and early adopters. If you are interested in this, please reach out in the comments below, we would love to hear your thoughts.
Big thanks to Adam Surak for joining the efforts on this topic!
Bonus link: There is a similar spec called Client hints, which expresses network information via a new set of request headers. I recommend you read the spec draft itself or read the blog post from Google Developers to see how you can leverage these headers.